A container running vLLM inside a VM just matched the same container on bare metal. On some runs it came out slightly ahead.
That is the headline of a July 2026 post on n0derunner by someone who works on performance at Nutanix. The setup was one NVIDIA RTX PRO 6000 Blackwell Server Edition (96 GB, 450 W), a dual socket Xeon Gold 6548Y+ host with 512 GB of DDR5, Kubernetes v1.34.1 on NKP 2.17.0, and AHV 11.0-1900 as the hypervisor. The load generator was AIPerf 0.5.0. The model was Llama 3.1 8B Instruct, served by vLLM. The author’s summary: the VM delivered about the same performance, or slightly better.
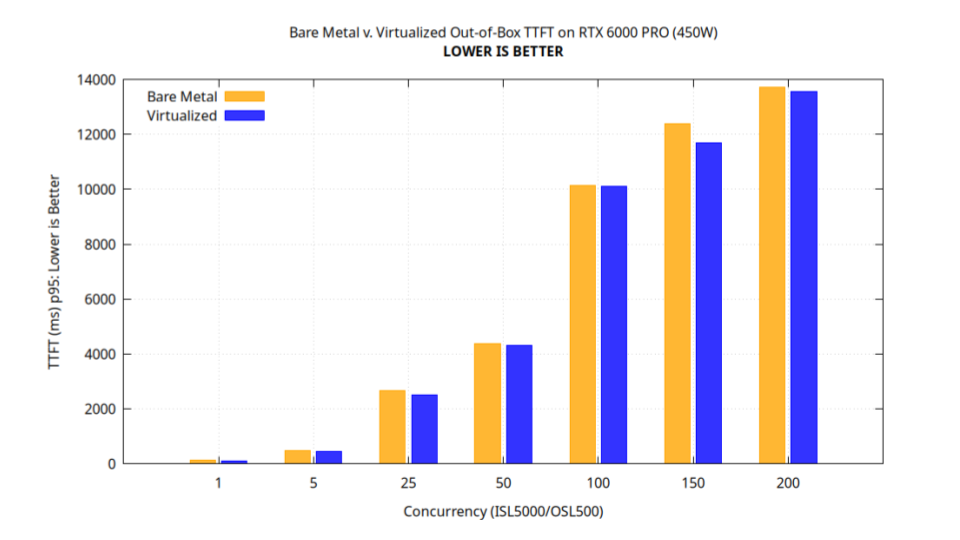
Two disclosures before we go on. The author works at Nutanix. I work in presales, Nutanix sits in my daily portfolio, and it is the platform I prefer. Neither of us is a neutral party. I look at performance data through an architectural lens. We need to isolate the exact mechanisms driving these numbers.
Look where the time goes.
Is the claim believable?
Yes, with caveats. Here is what other people measured, none of it from Nutanix.
| Source | What they ran | Result vs bare metal |
|---|---|---|
| VMware, MLPerf Inference v3.0 (Apr 2023) | 2 H100 PCIe and 4 A100 SXM, vGPU, VM given 16 logical cores | 94% to 105%. Lowest: RNNT Server at 94%. Highest: 3D U-Net on A100 at 105% |
| Broadcom, MLPerf Inference v5.0 (Apr 2025) | 8 H100 SXM, including GPT-J 6B and Mixtral-8x7B | 95% to 100% |
| Steininger et al., Computers (MDPI) (2026) | RTX 4500 Ada, Qwen2.5 0.5B, concurrency up to 5. Bare metal: 1309.7 ± 3.6 tokens/s | Lowest VM (Proxmox): 1283.2 ± 4.3 tokens/s, a 2.0% gap |
| dstack | One MI300X, VM versus bare metal | Near identical at concurrency 16 to 64. Bare metal slightly ahead at low concurrency |
Read the pattern, not the rows. Every source that publishes a number lands within about six percent of bare metal, and the gap goes both ways. But the first two come from the company that sells the hypervisor, dstack sells a platform, and the academic study tested a 0.5 billion parameter model at low load and calls its result “not a general claim.” VMware reports one benchmark above bare metal, at 105%, and does not attribute a cause.
So the claim is believable. “Slightly better” is the part that needs an explanation. I will get there.
Why would a hypervisor cost almost nothing here?
Semi technical layer.
Think of the hypervisor as a toll booth between the guest and the hardware. You pay only when you cross it. An inference server crosses it rarely.
The weights live on the card. The KV cache lives on the card. The matrix math happens on the card. On this GPU that means 96 GB of GDDR7 with up to 1,597 GB/s of memory bandwidth. The two phases of serving are both limited inside that card. Prefill, where the model reads your whole prompt, is limited by compute. Decode, where it writes one token at a time, is limited by how fast the GPU can read its own weights.
How much actually crosses the booth? Here is a back-of-envelope. The prompt length is my example, because the post does not publish its input and output lengths.
Prompt:           8,192 tokens
Crosses PCIe:     8,192 x 8 B = 65,536 B (token IDs, upper bound)
Copy time:        65,536 B / 55 GB/s = about 1.2 microseconds
Prefill compute:  2 x 8e9 params x 8,192 tokens = about 1.3e14 FLOPs
At 1 PFLOPS:      about 131 ms (a deliberately generous GPU)
The 55 GB/s comes from Cloudrift’s measurements of server class GPUs on PCIe Gen5. The 2N FLOPs per token rule comes from Kaplan et al., Table 1, ignoring the small attention term. Result: 1.2 µs << 131 ms. Five orders of magnitude. The weights load once at startup, and the KV cache never leaves the card, so they are not in the sum.
What does a long prompt actually stress?
Let us examine the physics of the workload.
The post says the team chose a larger input and output length “to maximize the communication between the CPU and GPU during the preload phase,” so any virtualization overhead would show. Per the math above, a longer prompt adds almost no CPU to GPU traffic. It adds compute. Long prompts shift the execution bottleneck onto the GPU: prefill is limited by compute, and decode by the card’s memory bandwidth. With the GPU as the limiting factor, CPU side overhead has little room to show.
The research points the same way. WukLab measured CPU scheduling inside vLLM and SGLang and found the relative cost grows when the rest of the pipeline gets faster. So the stressful test has the opposite shape: short prompts, a small model, a high request rate, many tiny steps. dstack saw bare metal pull ahead at low concurrency and credited faster kernel launches.
That makes this test a fair floor for the long prompt regime, not a worst case. The result fits the mechanism. The stated rationale and the mechanism point in different directions, and I may be missing something in AIPerf’s request path. I would like the author’s view on which mechanism he had in mind.
The post also leaves out the numbers you would need to reproduce it: the actual input and output lengths, the concurrency, the number of repeats, how CPUs were pinned, and whether the card was passed through whole or sliced as a vGPU. Everything below assumes whole card passthrough. I am sharing two questions with the author: how did AHV place this VM’s vCPUs and memory, and how were the bare metal threads pinned? Once I receive his answers, I will update this post with them.
What does the VM pay for, exactly?
Real technical layer.
Three things, and only one of them touches this workload hard.
Translating CPU memory addresses. A guest has its own page tables, and the hypervisor has another set beneath them. When the TLB misses, the hardware walks both. The agile paging paper (IEEE Micro, 2017) puts a native walk at 4 memory references on x86-64 and a nested walk at 24. It reports that virtualization raises page walk latency by two to three times. Huge pages shrink the damage by needing fewer TLB entries, which is why NVIDIA’s DGX KVM tuning guide recommends THP or HugeTLB. Why does it barely register here? Because the CPU’s hot loop is small: a scheduler, a few NumPy arrays. vLLM V1 even keeps its input tensors cached and applies only diffs each step. A small working set stays in the TLB. That last step is my inference, not a measurement. And the GPU’s own reads of its own memory never walk the host’s tables at all.
Reaching the device. With passthrough, VFIO exposes the device’s register regions to userspace through mmap and uses the IOMMU to confine the device’s DMA to memory it has been given. My reading: the guest driver talks to the real card, with no emulated device in the way. I found no benchmark that isolates this cost, so treat it as mechanism, not measurement. Bare metal is not exempt either. NVIDIA’s multi-GPU PCIe guidance for Maxine tells bare metal operators to set the IOMMU to passthrough mode for performance. That document is old, so check it against your driver version.
CPU cycles around the GPU. This is the real tax candidate. In NVIDIA’s CUDA Graphs example, a kernel that runs in 2.9 µs costs 9.6 µs per launch when you synchronize after every one, and 3.4 µs with graphs. Launch overhead is microseconds, paid again on every step for every kernel. The vLLM team measured up to 1.7x higher throughput in V1 than V0 without multi-step scheduling, and credited CPU overhead reductions, since the kernels were almost identical. WukLab found scheduling could eat up to about half of end to end latency in vLLM v0.5.4, an old version. A hypervisor can amplify that cost through vCPU scheduling delays. A modern vLLM has already cut much of it.
Then how does a VM come out ahead?
Defaults may favor the VM.
The host has two sockets, and on a typical dual socket server each PCIe slot hangs off one of them. On Kubernetes, the default CPU manager policy is none, so a pod’s threads can drift across cores until an administrator enables the static policy. Exclusive cores go only to Guaranteed pods with integer CPU requests under that policy. If AHV kept this VM’s vCPUs and memory on one NUMA node, that is a real operational advantage: locality without tuning. The post does not say how AHV placed it, and a pinned bare metal run would likely close the gap. That is the test to run.
How big can that effect be? Cloudrift tested VMs only, so it cannot tell you what this bare metal node did. It does show that defaults cut both ways: in several of its tests the default VMs were the slow ones. On an 8 GPU RTX PRO 6000 Blackwell VM, NCCL collective bandwidth rose from 8.4 GB/s to 20.5 GB/s just by pinning vCPUs, a 144% gain. On an H200 VM, exposing NUMA topology lifted STREAM memory bandwidth 7.3x. A plain FP16 matrix multiply barely moved. GPU resident math is insensitive. Everything around it is not.
That is a placement effect in the hundreds of percent, against a virtualization tax measured in single digits. Pin first. Compare second. dstack pinned its bare metal container to cores 0 to 12. The n0derunner post does not say what it did. The other candidate explanation is plain noise. MDPI reports run to run spreads of a few tenths of a percent. A “slightly better” with no repeats and no error bars is a lead worth testing, not yet a result.
Where does this stop being true?
Three places.
Multi-GPU is the first. Cloudrift’s H200 VM saw NCCL collective bandwidth fall from 20.2 GB/s to 8.6 GB/s, a 57% drop, when guest NUMA topology was exposed. One card never exercises that path. Broadcom’s 8 GPU runs held 95% to 100%, but they used deliberate configuration, including a VM setting for unified memory passthrough. It can work. It is not a given.
Model size and load shape are the second. The MDPI authors state their equivalence holds only in the non-saturating regime they tested.
Networking is the third. The post lists other nodes and a 25 Gbps network, but not where AIPerf ran or what path the requests took. Virtual switching is a cost this single card benchmark does not isolate.
For one card, one 8B model and long prompts, virtualization overhead looks small, and published results from several vendors agree. The mechanism is that almost nothing in the loop crosses the hypervisor. A VM can edge ahead when its defaults place work better than an untuned bare metal node does. Whether that happened here depends on pinning and variance the post does not show. Multi-GPU is the next test.
Look where the time goes.
- Published results from VMware, Broadcom and MDPI land within about six percent of bare metal.
- Count what crosses the VM boundary before you argue about percentages.
- Long prompts hide CPU side overhead; short prompts, small models and high request rates expose it.
- Pin CPUs on both sides before you compare, because placement moved one VM test by 144%.
- Report repeats and variance, so “slightly better” can be tested.
- Retest with multiple GPUs and your IOMMU settings before taking a single GPU result to a customer.
Published October 2, 2026
Citations
All links accessed October 2, 2026.
- n0derunner, “Containers in VM Vs Containers on Bare metal for AI workloads,” July 20, 2026. Link
- AIPerf, ai-dynamo project repository, GitHub. Link
- VMware Performance Engineering, “No Virtualization Tax for MLPerf Inference 3.0 Using NVIDIA Hopper and Ampere vGPUs and NVIDIA AI Software with vSphere 8.0 U1,” April 2023. Link
- Broadcom, “Broadcom Delivers Near Bare-Metal Performance for Virtualized AI/ML,” VMware Cloud Foundation blog, April 17, 2025. Link
- Steininger et al., “GPU Passthrough Across Virtualization Platforms for LLM Inference: Configuration Complexity and a Small-Model Performance Baseline,” Computers (MDPI), 2026, 15(8), 483. Link
- dstack, “Benchmarking AMD GPUs: bare-metal, VMs.” Link
- Lenovo Press, “ThinkSystem NVIDIA RTX PRO 6000 Blackwell Server Edition PCIe Gen5 GPU Product Guide.” Link
- vLLM project, “Taking vLLM Apart: A Practical Guide to Disaggregated Serving,” September 29, 2026. Link
- Cloudrift, “GPU VM Performance: Do vCPU Pinning and NUMA Topology Really Matter?” Link
- Kaplan et al., “Scaling Laws for Neural Language Models,” arXiv:2001.08361, 2020 (Table 1, Section 2.1). Link
- MLSys @ WukLab, “Can Scheduling Overhead Dominate LLM Inference Performance? A Study of CPU Scheduling Overhead on Two Popular LLM Inference Systems.” Link
- “Agile Paging for Efficient Memory Virtualization,” IEEE Micro, 2017. Link
- NVIDIA, “DGX-2 KVM Performance Tuning,” DGX best practices documentation. Link
- vLLM project, V1 alpha release announcement, January 27, 2025. Link
- Linux kernel documentation, VFIO driver API. Link
- NVIDIA Technical Blog, CUDA Graphs post. Link
- NVIDIA, “PCIe Multi-GPU Systems,” Maxine Triton 1.2.0 documentation, Appendices. Link
- Kubernetes documentation, “Control CPU Management Policies on the Node.” Link